 Maintlytics
The maintenance numbers your CMMS can't show you.
Maintlytics reads the work orders you already keep and turns them into checked KPIs, a shop-floor board, planning tools and reliability analysis — so the morning meeting starts with facts, not spreadsheets.
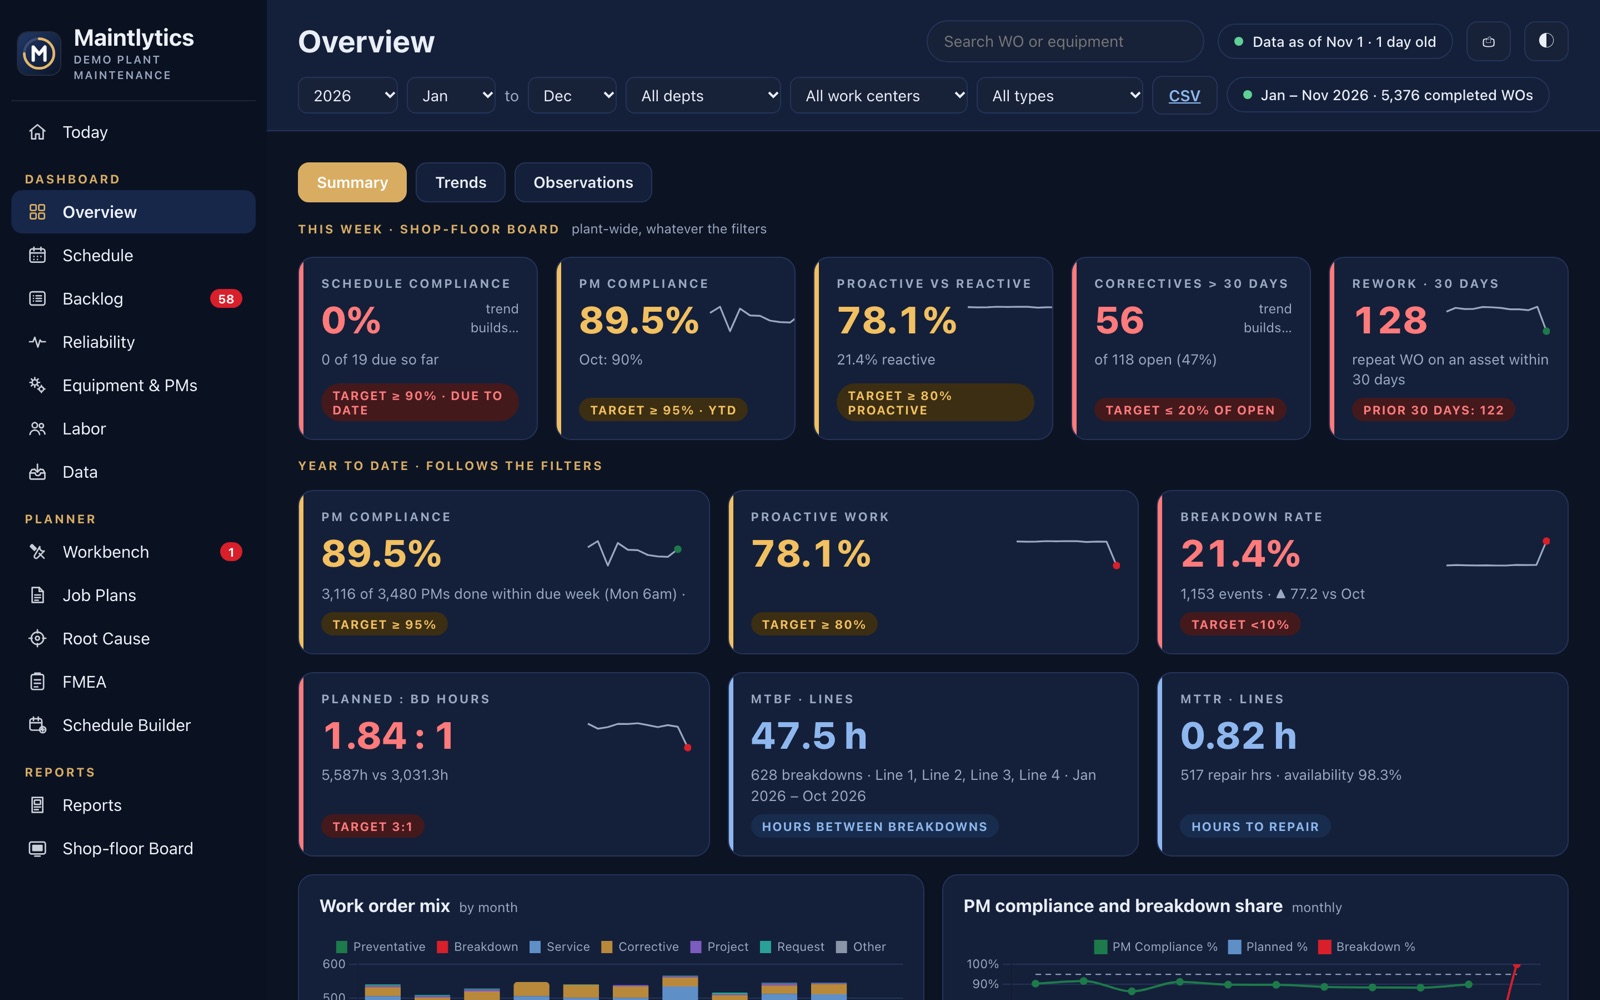
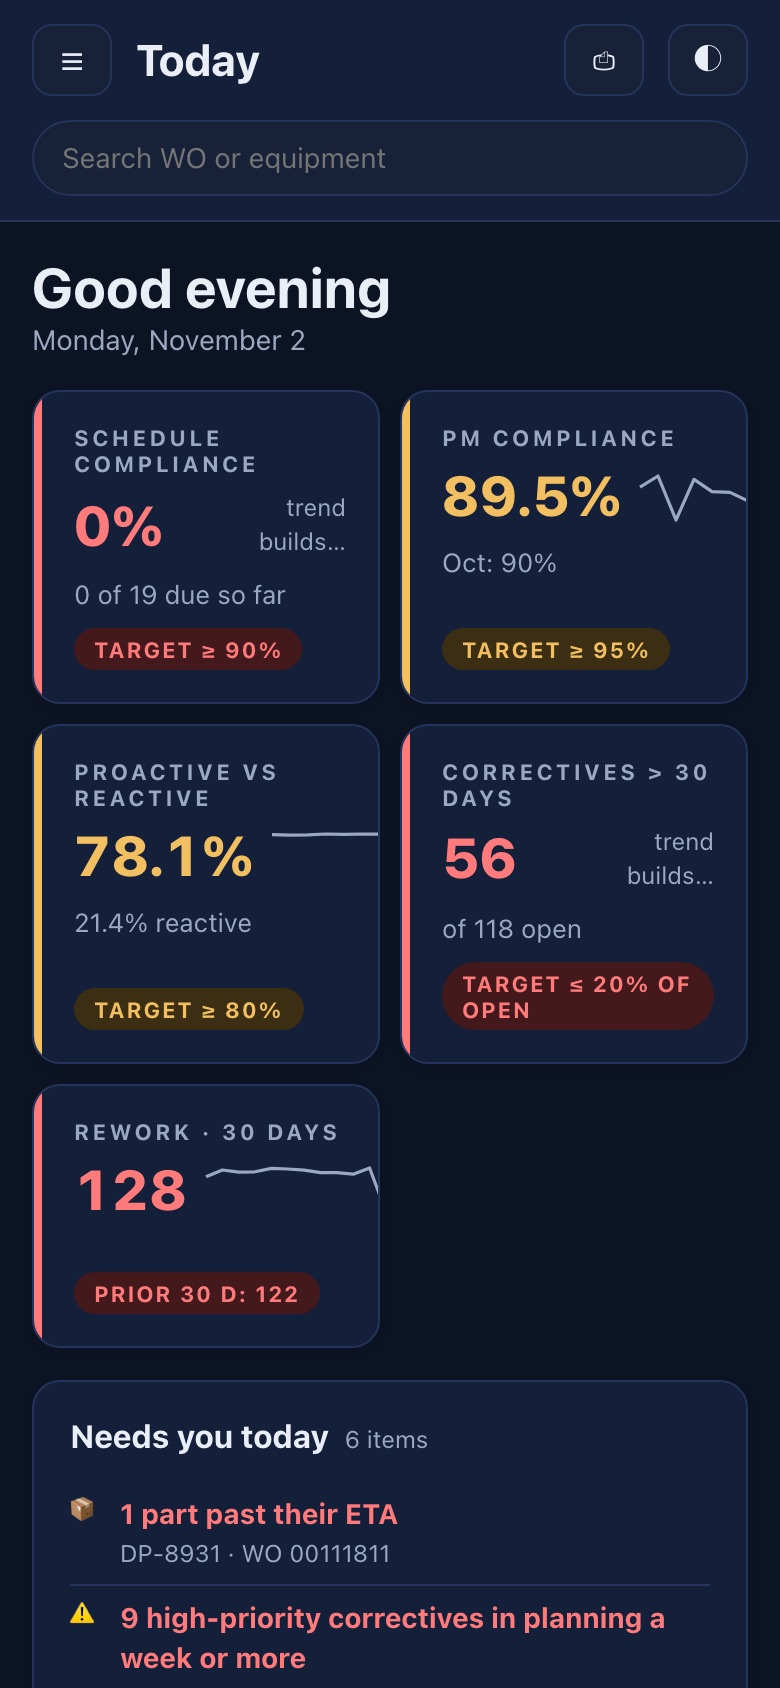
Screens show a made-up demo plant.
No new system to feed.
Your techs keep closing work orders in the CMMS they already use. Maintlytics does the rest.
Save the pages you already run
The completed work-order report, the open list, the shift schedules, MTBF pages, the equipment and PM lists. Drop them in Downloads — or import a CSV.
They import on their own
The Mac hub picks them up, merges them with what it has, and keeps history. Nothing is retyped.
Every number is checked
116 self-checks run after each import. Counts are cross-checked, and Data health lists anything that could make a number wrong.
Everyone sees the same truth
The Mac, every iPhone and iPad, any browser on the plant network and the TV on the floor show the same numbers.
From the morning meeting to the root cause.
KPI dashboard
Schedule and PM compliance, proactive vs reactive, backlog, MTBF, MTTR, rework and labor — with targets and trends.
Shop-floor TV board
A full-screen board for the floor that fits any screen, plus a printable copy of last week's board.
Reliability
Bad actors, MTBF/MTTR by line, Pareto, Weibull failure patterns and machines that are getting worse.
Equipment & PMs
Every PM with its machines and next due date, PM hours coming due, and the machines that break down with no PM.
Planning
A Workbench for correctives, a Schedule Builder against crew hours, and job plans written in your own Word layout.
Root cause & FMEA
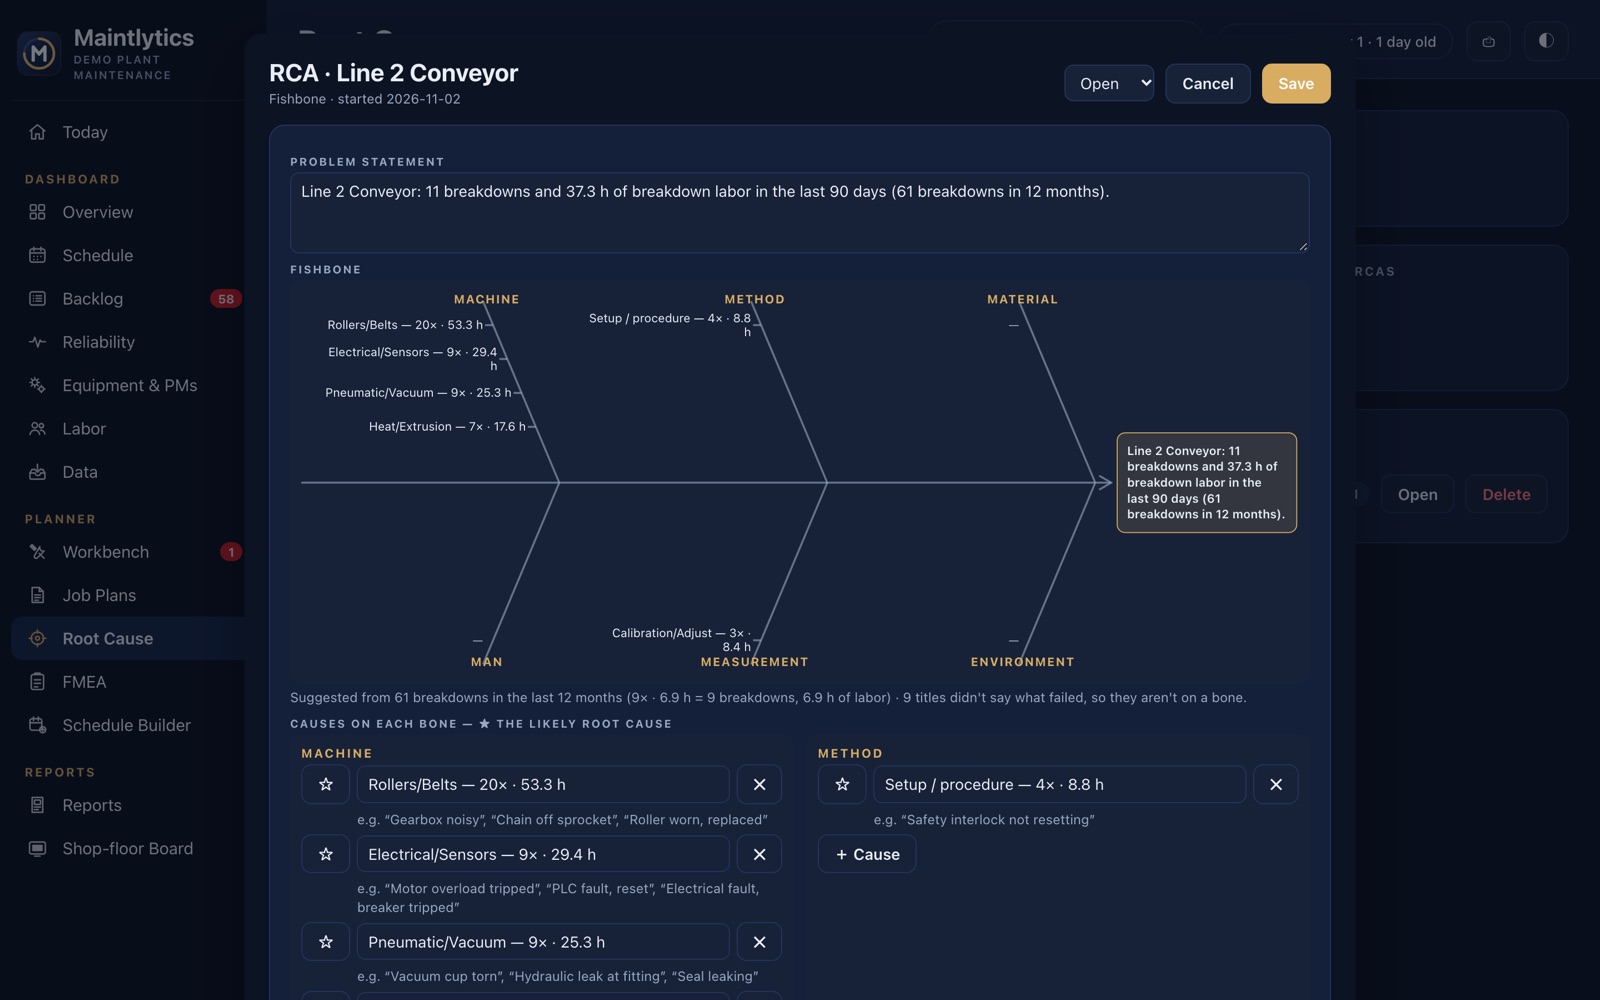
5 Whys, Fishbone and A3 started from the machine's history, and FMEAs scored from real breakdown counts.
Put the week on the wall.
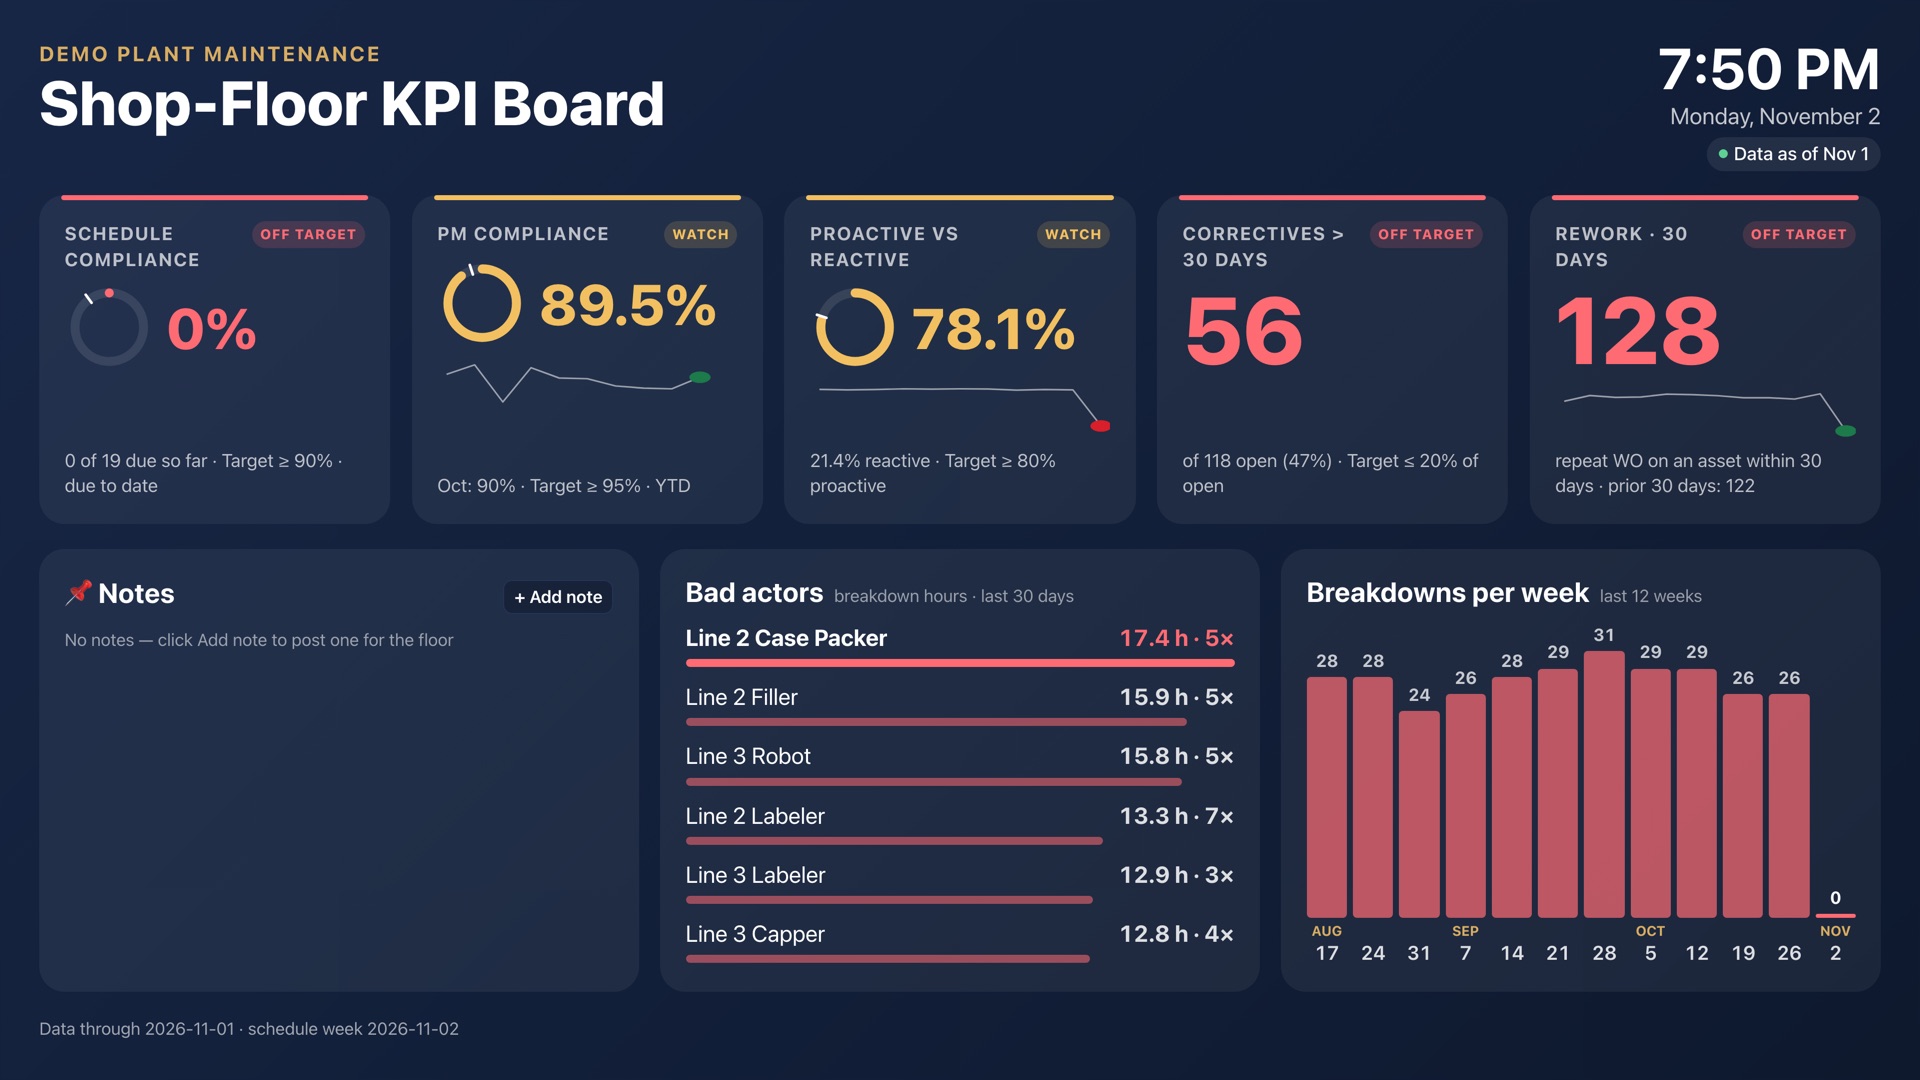
One URL turns any TV into a live KPI board. It resizes to the screen, refreshes on its own and needs no login on the floor.
- Schedule, PM compliance, proactive work, backlog and rework at a glance
- Bad actors and breakdowns per week
- Notes for the crew, and last week's board ready to print
Know which machines to fix first.
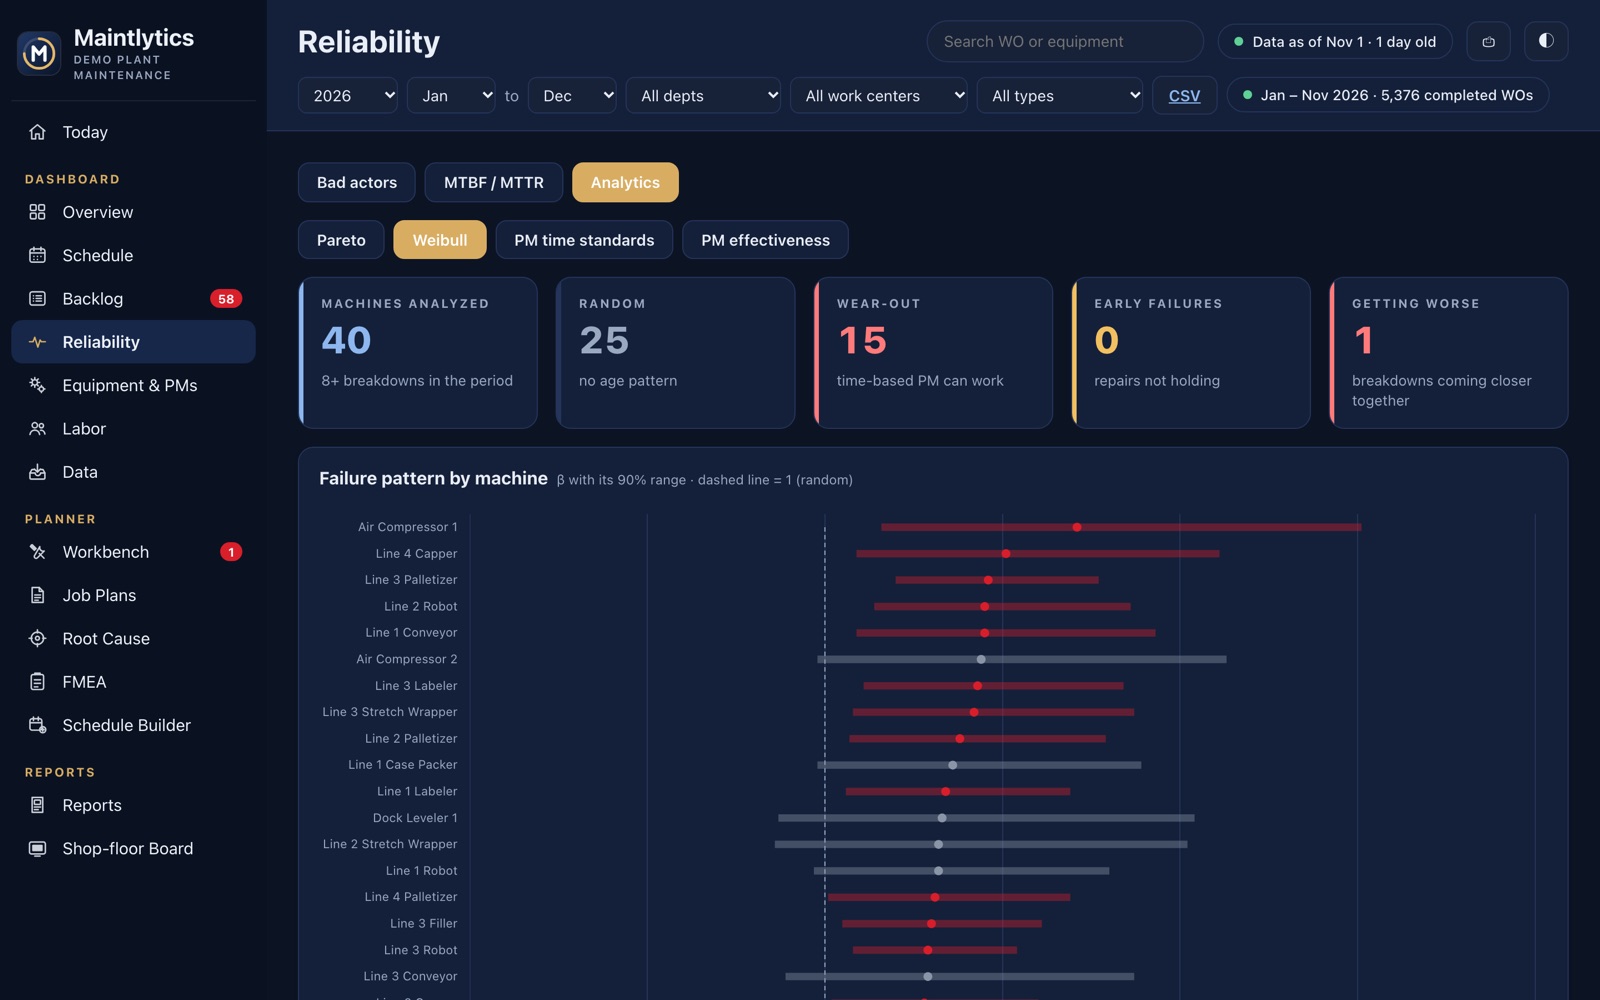
See where breakdown hours go, which machines wear out and which fail at random — so PMs go where they actually help.
- Bad-actor ranking by hours and events
- Weibull β with its range for each machine
- Breakdowns coming closer together, flagged
Analysis that starts with your data.
Start a Fishbone and the bones are already filled from the machine's last year of breakdowns. Start an FMEA and Occurrence comes from real counts.
- 5 Whys, Fishbone and A3, with countermeasures and an effect check
- FMEA risk scores, the PMs that control each failure mode, and actions
- Word copies for the binder
Just ask.
On iPhone, iPad and Apple Watch, ask Siri about the plant in plain words. Apple Intelligence understands the question on the device; Maintlytics answers it from your checked numbers — never a guess.
Questions are understood on the device and answered from your plant's own data. Your data isn't sent to an AI service.
Answers from the made-up demo plant.
Built to be checked, not just charted.
Maintenance numbers only help if people trust them. Maintlytics shows its work.
One hub. Every screen in the plant.
See it with your own work orders.
A demo takes 30 minutes. Bring a week of CMMS exports and see your own plant's numbers.